Angelina Terzieva
University of Chemical Technology and Metallurgy – Sofia, Bulgaria
https://doi.org/10.53656/igc-2024.21
Pages 234-245
Abstract. The purpose of this report is to track the investment activity in enterprises of the “Manufacturing of textile clothing“ sector. Based on data obtained from the National Statistical Institute, including tangible and intangible fixed assets, and through the application of horizontal analysis, the investment activity of companies in the examined sector during the period 2014-2020 is analyzed, and the economic impact of the investments made in production is determined.
Keywords: investments, economic effect, investment activity, clothing production
JEL: D25, L67
- Introduction
Investment decisions are at the core of any development strategy. Economic growth and prosperity depend on production capital, infrastructure, human capital, knowledge, overall productivity, and the quality of institutions. All these components of development suggest, to some extent, that the difficult decision must be made to invest economic resources in the present, with the hope of reaping future benefits, thereby betting on a distant and uncertain future time horizon. In making any investment decision, it is necessary to weigh the costs against the benefits and calculate how they accumulate over time. Such calculations are performed daily by private companies and the public sector at national, regional, and local level. Over time, a consensus has emerged regarding the basic principles for comparing costs and benefits when evaluating investments.
- Analysis of Investment Activity and Determination of the effect for the sector
Determining the impact on the “Textile Clothing Production” sector from investments made in it should provide information about the current trends in its development. The period under study covers the years from 2014 to 2020, inclusive. The effect of the investments will be established through the application of horizontal financial analysis (Tinchev, 1999, p. 71).
The choice of this method for analysis is justified by the fact that on the one hand, it was applied to study investment activity in the sector during a previous period, and on the other hand, it can most fully demonstrate the assertion that investments in the form of equipment and technology aimed at increasing competitiveness should be able to ensure a return on the capital with which they were made.
Investment, in a broad sense, encompasses the allocation of secured capital into various assets: tangible, intangible, and financial, which are necessary for the smooth running of the production process. The investments in the company are reflected in the assets of its balance sheet.
By its nature, each innovation project is an investment project, as I have no way to develop and implement innovation without incurred certain investment costs (Blagoev, 2021, p. 2). Investments are defined as cash for the purchase of assets that are likely to provide income, capital growth and other positive results over a long period of time (Blagoev, 2020, p. 339).
Based on information from the National Statistical Institute regarding expenditures for acquiring tangible and intangible fixed assets, and through the application of dynamic (horizontal) analysis, the changes in the investments made by enterprises in the „Manufacturing of textile clothing“ sector during the period 2014 – 2020 will be tracked (NSI, 2021, pp. 205 – 206).
Changes in investments in Tangible Fixed Assets by years from the analyzed period for the “Manufacturing of textile clothing” sector
- Change in the Amount for 2014:
∆2014= Investment Amount2014 –Investment Amount2013 = 105 912 – 89 836 = BGN 16 076 thousand
- Change in the Amount for 2015:
∆2015= Investment Amount 2015 – Investment Amount 2014= 11 0882– 105 912 = BGN 4 970 thousand
- Change in the Amount for 2016:
∆2016= Investment Amount 2016 – Investment Amount 2015= 98 681 – 11 0882 = BGN -12 201 thousand
- Change in the Amount for 2017:
∆2017= Investment Amount 2017 – Investment Amount 2016 = 99 792 – 98 681 = BGN 1 111 thousand
- Change in the Amount for 2018:
∆2018 = Investment Amount 2018 – Investment Amount2017 = 11 6961 – 99 792= BGN 17 169 thousand
- Change in the Amount for 2019:
∆2019 = Investment Amount2019 – Investment Amount2018 = 74 422 – 11 6961 = BGN -42 539 thousand
- Change in the Amount for 2020:
∆2019 = Investment Amount2020 – Investment Amount 2019 =74 449 – 74 422= BGN 27 thousand
The results indicate periods of both increased and significantly decreased investment activity in clothing production enterprises regarding the acquisition of tangible fixed assets (the introduction of new modern production technologies). The overall change for the period analyzed, ∆2020 – 2014, is calculated as: ∆2020 – 2014 = Amount of investments 2020 – Amount of investments 2014 = 74 449 – 105 912 = BGN -31 463 thousand.
Considering that the textile garment manufacturing sector primarily sells its products in the international market, the overall decrease in investments in equipment and technology will lead to a limitation in the range of products manufactured (since the production of fashion items requires the introduction of the latest equipment and technology), a reduction in production efficiency, which in turn will impact the competitiveness of the companies (Kadieva & Dimitrova, 2023, p. 103)
Changes in investments in Intangible Fixed Assets by Year from the analyzed period for the “Manufacturing of textile clothing” sector
Change in the Amount for 2014:
∆2014 = Investment Amount2014 – Investment Amount2013 = 24 386 – 28 459 = BGN – 4 073 thousand
- Change in the Amount for 2015:
∆2015 = Investment Amount2015 – Investment Amount2014 = 25 639 – 24 386 = BGN 1 253 thousand
- Change in the Amount for 2016:
∆2016 = Investment Amount2016 – Investment Amount2015 = 24 993 – 25 639= BGN -646 thousand
- Change in the Amount for 2017:
∆2017 = Investment Amount2017 – Investment Amount2016 = 27 200 – 24 993 = BGN 2 207 thousand
- Change in the Amount for 2018:
∆2018 = Investment Amount2018 – Investment Amount2017 = 33 848 – 27 200 = 6 648 thousand BGN
- Change in the Amount for 2019:
∆2019 = Investment Amount2019 – Investment Amount2018 = 36 736 – 33 848 = BGN 2 888 thousand
- Change in the Amount for 2020:
∆2020 = Investment Amount2020 – Investment Amount2019 = 35 423 – 36 736= BGN -1 313 thousand, his is due to the continuing trend since 2009 for leading companies to register their own trademarks (Iventi, Frant, Andrews, etc.) to establish themselves in both the Bulgarian and international markets, as well as a reduction in subcontracting.
The data shows a decrease in investments in tangible fixed assets and an increase in investments in intangible fixed assets in the last four years of the analyzed period in the textile garment manufacturing sector. Comparing the overall change in investments in tangible fixed assets for the period 2009 – 2014 with the values for 2014 – 2020, it is found that they have decreased from BGN 4 253 thousand in the first period to BGN -31,463 thousand. An opposite trend is observed in the overall change in investments in intangible fixed assets for the specified periods, increasing from BGN -1 828 thousand to a positive value of BGN 11 037 thousand.
To gain a better understanding of investment activity in the enterprises for the production of textile clothing, it is necessary to reveal the relationship between the revenue generated by these companies and the investments they make in tangible and intangible assets. To study this relationship, the dynamics of revenue generated in the textile garment manufacturing sector for the period 2014-2020 will first be analyzed.
Dynamics of sales revenue in the “Manufacturing of textile clothing” sector by year for the analyzed period
- Change in the Amount for 2014:
∆2014 = Revenue Amount2014 – Revenue Amount2013=2 575 726 – 2 419 560 = BGN +156 166 thousand
- Change in the Amount for 2015:
∆2015 = Revenue Amount2015 – Revenue Amount2014 =2 688 727 – 2 575 726= BGN +113 001 thousand
- Change in the Amount for 2016:
∆2016 = Revenue Amount2016 – Revenue Amount2015=2 787 381 – 2 688 727= BGN +98 654 thousand
- Change in the Amount for 2017:
∆2017 = Revenue Amount2017 – Revenue Amount2016= 2 835 774 – 2 787 381= BGN +48 393 thousand
- Change in the Amount for 2018:
∆2018 = Revenue Amount2018 – Revenue Amount2017 = 2 935 437 – 2 835 774 = BGN +99 663 thousand
- Change in the Amount for 2019:
∆2019 = Revenue Amount2019 – Revenue Amount2018 = 2 911 296 – 2 935 437 = BGN -24 141 thousand
- Change in the Amount for 2020:
∆2020 = Revenue Amount2020–Revenue Amount2019 = 2 561 188 –2 911 296 = BGN -350 108 thousand
The calculations reveal a decrease in the total revenues over the entire period, with the overall decrease in the value of total revenues being ∆2020 – 2014 = Revenue Amount (2020) – Revenue Amount (2014) = 2 561 188 – 2 575 726 = BGN -14 536 thousand. This indicates that in order for companies to remain competitive in the Bulgarian and European markets, it is necessary to introduce new technologies in production. Particular attention should be given to the implementation of automated cutting systems in the cutting section, which will reduce waste of primary raw materials (fabric, lining, and fusible interfacing) and auxiliary materials (cutting paper) (Dimitrova et al., 2021, p. 65).
Comparing the dynamics of total revenue growth for the period 2009-2014 with the data from the analyzed period, it is found that from BGN 728 548 thousand in the first period, the value in the second period reaches BGN -14 536 thousand.
Net sales revenue holds a key place in the system of indicators for analyzing and evaluating the performance of companies. The dynamics of the net revenue generated by companies operating in this sector is presented in Figure 1.
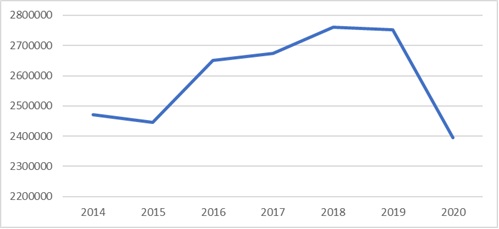
Figure 1. Dynamics of Net Revenues for the Period 2014-2020 in the Clothing Production Sector
The figure shows that after an initial decrease from BGN 2 470 120 thousand in 2014 to BGN 2 445 534 thousand in 2015, there is a continuous increase to BGN 2 760 768 thousand in 2018, followed by a decline in the last two years of the analyzed period, with the value for 2020 reaching BGN 2 395 778 thousand. This practically confirms the established lack of investment during the last year of the analyzed period and for the period as a whole. The low values in 2020 are also due to the restrictions imposed due to the pandemic situation and the closure of borders (Nikolova-Alexieva &Valeva, 2021, pp.89 – 90).
Change in the Total Expenses by Year in the “Manufacturing of textile clothing” sector
- Change in the Amount for 2014:
∆2014 = Total expenses 014 – Total expenses2013 = 2 445 534 – 2 470 120 = BGN – 24 586 thousand
- Change in the Amount for 2015:
∆2015 = Total expenses Total expenses2015 – Total expenses2014 = 2 483 634 – 2 445 534 = BGN +38 100 thousand
- Change in the Amount for 2016:
∆2016 = Total expenses2016 – Total expenses2015 = 2 566 504 –2 483 634 = BGN +82 870 thousand
- Change in the Amount for 2017:
∆2017 = Total expenses2017 – Total expenses2016 = 2 638 716– 2 566 504= BGN +72 212 thousand
- Change in the Amount for 2018:
∆2018 = Total expenses2018 – Total expenses2017 = 2 718 448– 2638716 = BGN +79 732 thousand
- Change in the Amount for 2019:
∆2019 = Total expenses2019 – Total expenses2018 = 2 707 798 –2 718 448= BGN -10 650 thousand
- Change in the Amount for 2020:
∆2020 = Total expenses2020 – Total expenses2019 = 2 337 745– 2 707 798= BGN -370 053 thousand
The obtained values indicate a decrease in total expenditure during the last years of the analyzed period, with the overall change in expenditure for the period being is /∆2020 – 2014 = Total expenses (2020) – Total expenses (2014) = 2 337 745 – 2 445 534 = BGN -107,789 thousand/.
This is due to a decrease in the volume of production during the period 2014 – 2020 and the costs incurred for the renewal of production capacities.
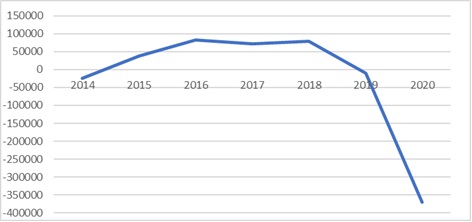
Figure 2. Dynamics of total costs in the textile clothing manufacturing sector
To determine the impact of investments in production on the profits of enterprises in this industrial sector, the amount of realized profit will be calculated, and its changes during the analyzed period will be tracked, as shown in Figure 2.
Realized Profit by Year in the “Manufacturing of textile clothing” sector for the period 2014 – 2020.
2014
Total Revenue 2014– Total Costs 2014 = 2 575 726 –2 445 534 = BGN +130 192 thousand
2015
Total Revenue 2015– Total Costs 2015 = 2 688 727– 2 483 634 = BGN +38 589 thousand
2016
Total Revenue 2016– Total Costs2016= 2787381– 2566504 = BGN +104 113 thousand
2017
Total Revenue 2017– Total Costs2017 = 2835774– 2638716 = BGN +197 053 thousand
2018
Total Revenue 2018– Total Costs2018 = 2935437– 2718448 = BGN +216 989 thousand
2019
Total Revenue 2019– Total Costs2019= 2911296–2707798 = BGN +203 498 thousand
2020
Total Revenue 2020– Total Costs2020= 2 561 188–2 337 745 = BGN +223 443 thousand
The total change for the period 2014-2020 /Realized Profit (2020) – Realized Profit (2014) = 223 443 – 130 192/ amounts to BGN 93 251 thousand, which indicates a decrease compared to the period 2009-2014, during which the total change was BGN 116 461 thousand. The realized increase in profit during the analyzed period is due, on the one hand, to investments made in previous periods related to equipment and technology. On the other hand, we believe that this increase is largely due to the growth of investments in intangible assets, which helps companies to market their own products, where profits are significantly higher than contract work. By reducing contract work, opportunities for additional financial resources are created, which can be used to purchase new equipment and technology in enterprises in this sector. This will increase the competitive advantages of companies compared to other manufacturers.
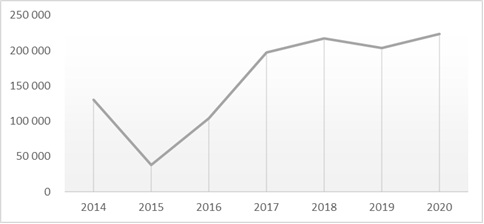
Figure 3. Dynamics of Profit in the Textile Clothing Production Sector (in thousand BGN)
To determine the effect of investments on the activities of companies in the „Textile Clothing Manufacturing“ sector, it is necessary to study the dynamics of their profitability, as profitability is one of the main indicators that provide information about the economic results achieved when implementing innovation-driven investments. Profitability reflects the level of efficiency of sales revenue, the use of assets, and the return on capital (Blagoev, 2021, p.2)
The change in profitability based on total revenue realized by companies in the “Textile Clothing Manufacturing” sector will be calculated using Formula 1 and will be presented graphically in Figure 4.
Determination of Profitability Based on Total Revenue
![]()
Equation 1. Profitability Based on Total Revenue
Profitability for 2014:
![]()
Profitability for 2015:
![]()
Profitability for 2016:
![]()
Profitability for 2017:
![]()
Profitability for 2018:
![]()
Profitability for 2019:
![]()
Profitability for 2020:
![]()

Figure 4. Dynamics of profitability based on revenues in the Textile clothing manufacturing sector
The data shows that after an initial significant decline during the 2014-2015 period, profitability in the analyzed sector gradually increased until the end of the period, with a slight decrease in 2019. Comparing the profitability data for the analyzed period with those for 2009-2014, it can be asserted that investments in new long-term tangible assets during the previous period contributed to the increase in this indicator during the current period. This confirms the assertion that returns on investments in new long-term tangible assets require more time (Karev, 2018, p. 309).
To calculate the profitability based on total costs, Formula 2 was used, and the changes in profitability based on total costs within the analyzed period are presented in Figure 5.
Determination of employment on the basis of total costs
![]()
Equation 2. Employment on the Basic of Total costs
Profitability for 2014:
![]()
Profitability for 2015:
![]()
Profitability for 2016:
![]()
Profitability for 2017:
![]()
Profitability for 2018:
![]()
Profitability for 2019:
![]()
Profitability for 2020:
![]()
The data indicates that the direction and degree of the dynamics of profitability based on total costs and total revenues follow similar trends, with declines in this indicator also observed in 2015 and 2019. Toward the end of the period, the trends point towards an increase in both costs and their profitability, indicating that the investments made are effective.
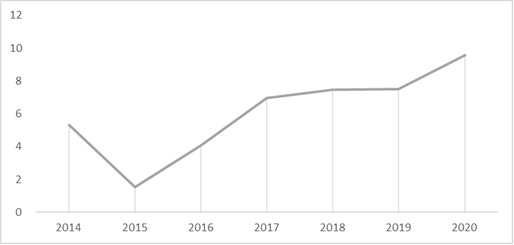
Figure 5. Dynamics of Profitability Based on Total Expenses in the Textile Clothing Production Sector
- Conclusions
Based on the analyses, a general decrease in investments in long-term tangible assets and an increase in the value of intangible long-term assets and the total realized profit were observed. A general decrease during the analyzed period is noted for the indicators of realized revenues and total costs, with the greatest decrease observed in the latter.
Despite the negative trends in investment activity during the analyzed period compared to the 2009-2014 period, the results at the end of the analyzed period show not only an increase in costs but also in their profitability, which indicates that the investments made are effective.
REFERENCES
Blagoev, D. (2021). Applied Aspects of Investment and Innovation in Bulgarian Companies. SHS Web of Conferences, 120, 02025. https://doi.org/10.1051/shsconf/202112002025
Blagoev, D. (2020). Investment Activity of Industrial Enterprises and Their Importance for the Development of the Regions in the Country (Following the Example of a Specific Region). Trakia Journal of Sciences, 18, 338 – 345. https://doi.org/10.15547/tjs.2020.s.01.057
Dimitrova, K., Panayotova, T. & Veleva, N. (2021). Model for Research into the Factors Influencing the Effective Planning and Management of Production Capacity. Annual journal of Technical University of Varna, 5(1), 65 – 75. https://doi.org/10.29114/ajtuv.vol5.iss1.237
Kadieva, Z. & Dimitrova K. (2023). A model for Evaluating Information Security Systems in Industrial Enterprises and Assessing Its Impact on Increasing the Competitiveness of Enterprises. Journal scientific and applied research, 24(1), 102 – 115. https://doi.org/10.46687/jsar.v24i1.373
Karev, N. (2018). Impact of Investments in Technology Transfer on the Competitiveness of Apparel Manufacturing Enterprises. In Jubilee scientific and practical conference – Challenges to industrial growth in Bulgaria (pp. 302 – 309). https://www.industrialgrowth.eu/wp-content/uploads/2018/11/32.pdf
Nikolova-Alexieva, V. & Valeva. K. (2021) Influence of Covid-19 on the Innovation Activity of the Bio-sector in Bulgaria. Knowledge International Journal, 49(1), 89 – 95. https://ikm.mk/ojs/index.php/kij/article/view/4623/4616
National Statistical Institute (NSI). (2022). Statistical Yearbook 2021. https://nsi.bg/sites/default/files/files/publications/God2021.pdf
Tinchev, M. (1999). Financial and economic analysis. Thrace – M.